FindR's Field Workflow StudyFindR's Field Workflow Study
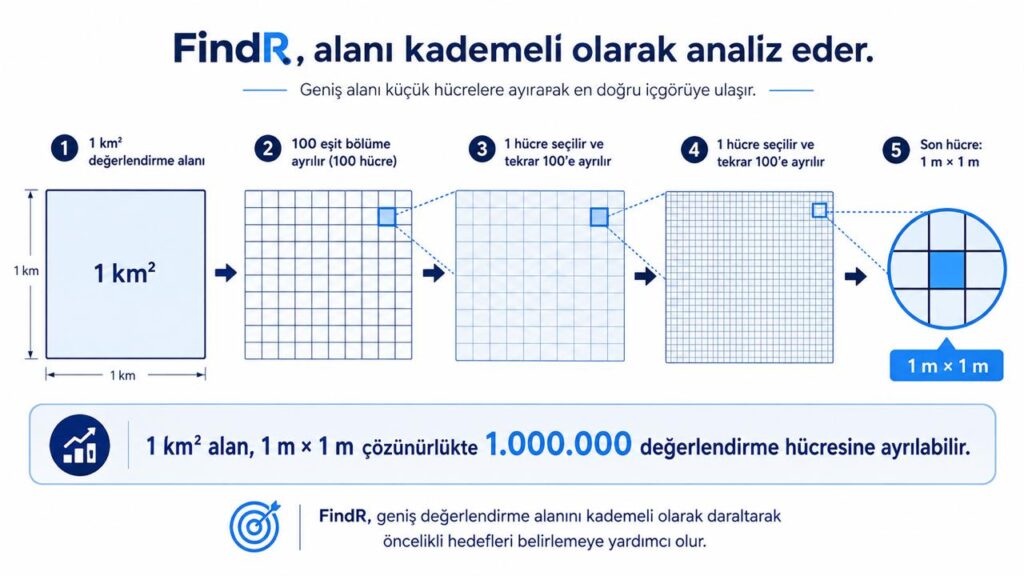
To illustrate visually how the FindR algorithm operates over a given area, an exploration site of 1 km² may be taken as an example.
The system converts this area into a high-resolution grid structure, dividing it into a large number of independent evaluation cells. For instance, if a grid resolution of 1 metre were theoretically used, a 1 km² area could consist of approximately 1 million separate grid cells.
The purpose here is not merely to divide the area geometrically. Each cell is evaluated as a multidimensional data profile formed by the data available for its corresponding location.
For each evaluation point or cell, insofar as they are available:
- geological,
- lithological,
- geochemical,
- physical,
- chemical,
- surface,
- soil,
- drilling,
- laboratory,
- and other measurable parameters associated with the target resource
are brought together to form the characteristic data profile of that location.
This profile is then compared with the successful and unsuccessful exploration results held within FindR’s extensive historical reference data bank.
The reference population formed by approximately 30 years of accumulated historical data enables the algorithm to compare not only environments in which a resource was found, but also environments in which no resource was found, which proved uneconomic, or which did not deliver the expected result.
For this reason, for each location the algorithm does not only ask:
“Does this point resemble an area that was successful in the past?”
It also evaluates the question:
“Which environments that appear similar but proved unsuccessful in the past does this point also resemble?”
This two-way comparison is one of the fundamental elements of FindR’s target prioritization approach.
The Multidimensional Computation Process
Each cell or evaluation point is not assessed on the basis of a single measurement or a single parameter.
FindR’s algorithmic architecture seeks to determine the relative position of each location within the historical reference population by evaluating a large number of available variables together.
Within this process, multiple analytical stages are applied, such as:
Raw and historical data → Data cleaning → Standardization → Feature generation → Multidimensional feature profile → Comparison with historical analogues → Analysis of positive and negative outcomes → Variable weighting → Similarity analysis → Spatial evaluation → Target prioritization
The resulting output is therefore not a simple “map scan.” It is a high-dimensional and iterative computational process requiring a large number of historical observations and data layers to be evaluated within the same analytical framework.
Owing to the scope of this process and the size of the historical data set used, the algorithmic analysis of a project may take approximately 3 to 8 weeks to complete.
Progressive Narrowing of the Area
The aim of the algorithm is not to treat all points within the 1 km² area as being of equal priority.
In the first stage, the entire area is evaluated as a broad candidate space.
Subsequently, higher-priority zones within the area are identified by taking into account historical similarities, relationships with positive and negative outcomes, and the combined effects of other variables.
This process may be visualized progressively as follows:
1 km² Exploration Site
↓
High-resolution grid / hundreds of thousands or approximately 1 million evaluation cells
↓
The multidimensional data profile of each cell
↓
Comparison with the historical reference data bank spanning approximately 30 years
↓
Joint evaluation of successful and unsuccessful historical analogues
↓
Multidimensional similarity and target prioritization analysis
↓
Comprehensive algorithmic computation that may take weeks
↓
Identification of priority zones and targets
↓
Narrowing down of high-priority investigation areas
↓
“Evaluation and classification by FindR of potential reservoir areas identified as a result of conventional geological, geophysical and drilling studies”
The Key Message to Be Conveyed in the Visual
The point to be emphasized in particular in the graphic is that FindR does not produce results by looking at only a few selected points.
FindR divides a broad exploration area into a large number of evaluation cells at high resolution, compares the available multidimensional data profile of each location with historical successful and unsuccessful exploration environments, and then progressively brings the strongest targets within the wider area to the fore.
In this way, a large exploration licence or field is not reduced to a single drilling point in one step. Instead, the algorithm establishes a hierarchical targeting process advancing from a broad area to narrow target areas and, ultimately, to priority investigation or drilling locations.
Technological Scalability
The theoretical computational load of this approach may grow considerably as the evaluation resolution and the number of usable variables increase.
For example, dividing a 1 km² area into approximately 1 million cells at 1-metre resolution and comparing each cell against historical reference populations across hundreds or more variables may become a far larger computational problem than a simple map analysis in the classical sense.
FindR’s long-term technology vision is for such high-dimensional computational problems to be carried out in far shorter periods through advanced artificial intelligence, high-performance computing and the quantum computing technologies expected to mature in the future.
It is anticipated that comprehensive computational processes which today may take weeks could in future be reduced to days — and, in certain computational scenarios, even to hours — depending on the data structure and problem class involved.
For this reason, FindR’s technological vision is founded not merely on using more data, but on establishing a scalable analytical architecture capable of computing larger data universes at higher spatial resolution and across more complex multidimensional relationships.